Charts - Annotation

Contents
Adding annotations |
You can add annotations - lines, shapes, text, etc. - to the charts. To do that, first select which annotation you're adding from the Draw tab on the ribbon menu (by default it is line).
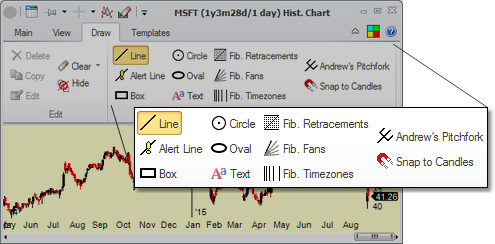
After you selected which annotation to draw, place it on the chart by pressing the mouse button where you want the drawing to start, dragging it until the line (or whatever other annotation you're drawing) is where you want it, then releasing the button.
One of the annotation types - Alert Line - will also add a Trendline Alert alert to the system when it is drawn.
NOTE: There are some helper keys that you can use when drawing lines on the chart:
•Pressing the
•Pressing the
•Pressing the
•Pressing the |
NOTE: There is a special Drag-Scroll selection in annotations (
This selection will allow you to scroll the chart by clicking and dragging on it. In order to get back to being able to draw on the chart, select one of the other annotation options. |
Annotations on sub-charts |
Most people draw annotations on the main (price) chart, but they can also be drawn on the sub-charts that plot indicators - above or below the main chart.
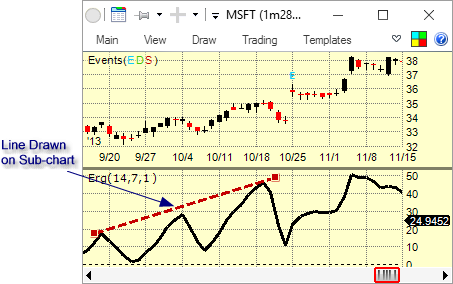
Note that on sub-charts, the annotations "belong" to the first indicator on the sub-chart. If you add another indicator and link it to the sub-chart, add it after the indicator already on the sub-chart if you want to preserve the annotations already drawn.
Selecting/modifying existing annotations |
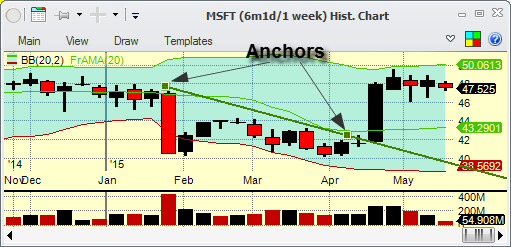
Once the annotation is placed on the chart, it can be moved or modified. Click on it to select it. Once it is selected, its anchor points (the points that define the line, for example) will show. You can drag the line or its anchor points in order to modify it. Hit the ![]() key to remove the annotation from the chart. For text, ovals and box annotations, you can also rotate them by dragging the rotate icon on the selected item.
key to remove the annotation from the chart. For text, ovals and box annotations, you can also rotate them by dragging the rotate icon on the selected item.
Changing annotation parameters and colors |
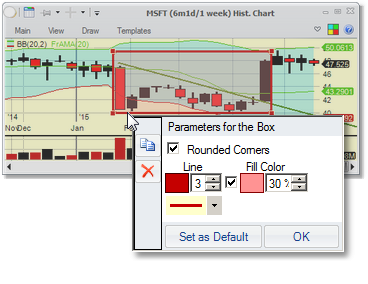
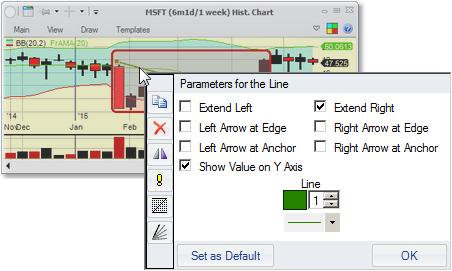
Right-clicking on an annotation will bring up its parameter editor. In it, you can change various parameters for the annotation (for the box above, you can make it have rounded corners. For a line, there are more parameters available. You can also change colors, line thickness etc.
The icons on the left of the annotation parameter editor allow you to make a copy of the annotation, delete it, for a line make a mirror copy, or convert the line to fibonacci retracement or a fibonacci fan. For lines, you can also (if the chart type allows) switch the line or a Fibonacci annotation to be an alert or, if it is already an alert, to remove the alert.
The Set as Default button will, if clicked, take the current annotation's parameters and save them so any time you create another annotation of this type, it will be initially set to these parameters
Other annotation actions |
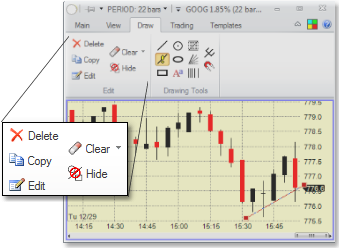
The Edit subsections of the Draw tab on the ribbon menu allows you to Delete the selected annotation, make a Copy of it, or Edit its parameters. Clicking the Hide button will hide all the annotations (clicking it again will show them), and the Clear will allow you to select which annotations to clear from the chart.
Sharing annotations between charts |
There is an Annotations Unique Per Chart setting in Settings - Charts - General. This controls whether the annotations you draw are shared between several same-symbol charts. If the setting is not checked, every annotation you draw is only shown on the chart on which you drew it. If it is checked, the annotation you draw will show up on all charts for this particular symbol and of this particular chart type. If you move it on one chart, the modifications will apply on all charts.
Automatic Fibonacci Fans and Retracements |
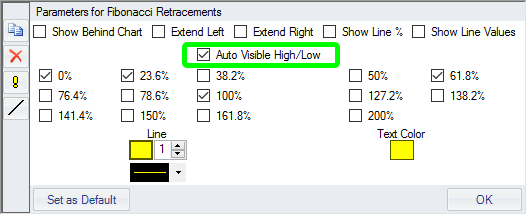
When you draw a Fibonacci Retracement on the chart, you can make it automatically place itself on the high/low of the visible portion of the chart. Just select the checkbox in the parameters of the annotation after right-clicking on it.