Charts - Frequency

Contents
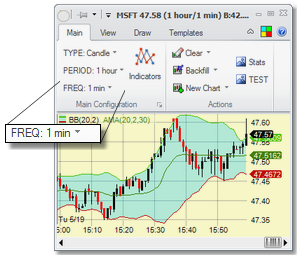
The chart's Frequency can be set on the Main tab of the ribbon menu.
Frequency for Time-Based Charts (Line, Line Tick, Candle and OHLC) |
|
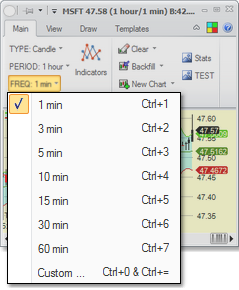
For time-based charts, the frequency is the time-period of one candle/bar on the chart, in minutes. Usually it is not set to less than one minute, though it can be.
For Line Tick charts, there are no candles or bars, but the frequency determines how indicators are calculated.
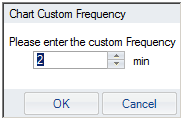
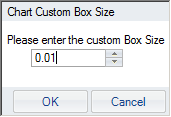
The dropdown menu contains popular options. To set it to a custom period, select the Custom option and the selection dialog will show up where you can set any period you like:
|
|
Frequency for Tick Charts (Tick Candle and Tick OHLC) |
|
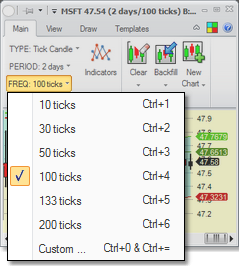
For Tick Charts, the frequency is the number of ticks that make up one candle/bar.
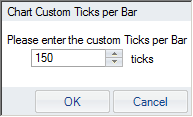
To set it to a custom number of ticks not in the menu, select the Custom option and the selection dialog will show up where you can set any period you like:
|
|
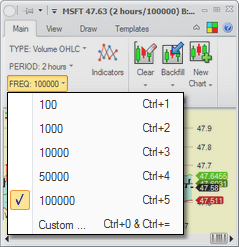
Frequency for Volume Charts (Volume Candle and Volume OHLC) |
|
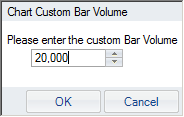
For Volume Charts, the frequency is the total volume of trades that make up one candle/bar.
To set it to a custom volume number not in the menu, select the Custom option and the selection dialog will show up where you can set any period you like:
|
|
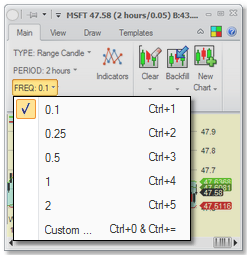
Frequency for Range Charts (Range Candle and Range OHLC) |
|
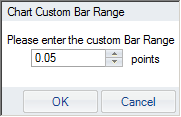
For Range Charts, the frequency is the price range (or height) of one candle/bar.
To set it to a custom range not in the menu, select the Custom option and the selection dialog will show up where you can set any period you like:
|
|
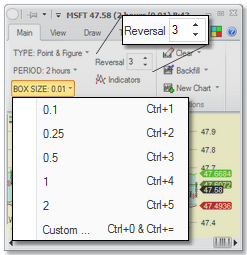
Frequency for Point & Figure Charts |
|
For Point & Figure Charts, frequency is replaced by Box Size, which determines the price range for each X or O that is on the chart. There is also another parameter that shows up - Reversal.
To set the Box Size to a custom value not in the menu, select the Custom option and the selection dialog will show up where you can set any period you like:
|
|
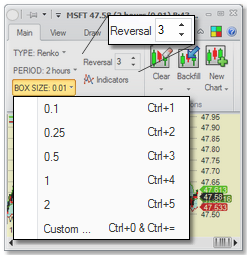
Frequency for Renko Charts |
|
For Renko Charts, frequency is replaced by Box Size, which determines the price range for each X or O that is on the chart. There is also another parameter that shows up - Reversal.
To set the Box Size to a custom value not in the menu, select the Custom option and the selection dialog will show up where you can set any period you like:
|
|