Charts - Period

Contents
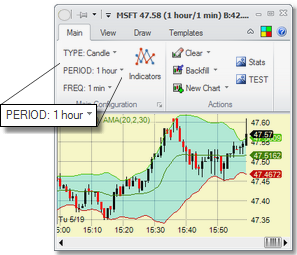
The chart's Period can be set on the Main tab of the ribbon menu.
Periods for Intraday Charts |
|
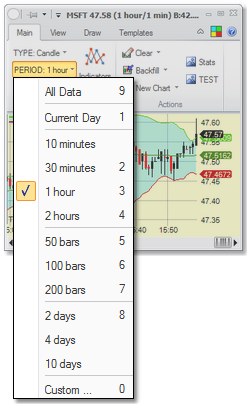
You can set the Period of the chart based on
•Time: in minutes, hours or days
•Bars/Candles: number of bars/candles shown. For time-based charts that would correlate to time as well.
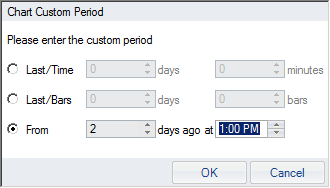
•From: (this can only be done with Custom time periods - show the period from a particular point in time
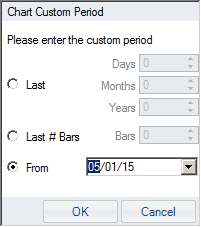
The dropdown menu contains popular options. To set it to a custom period, select the Custom option and the selection dialog will show up where you can set any period you like:
|
|
Periods for Historical Charts |
|
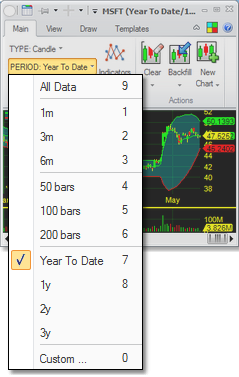
You can set the Period of the chart based on
•Time: in days, months or years
•Bars/Candles: number of bars/candles shown.
•From: (this can only be done with Custom time periods - show the period from a particular point in time
The dropdown menu contains popular options. To set it to a custom period, select the Custom option and the selection dialog will show up where you can set any period you like:
|
|
The chart's period will also change as you navigate the chart or zoom in/out in it.
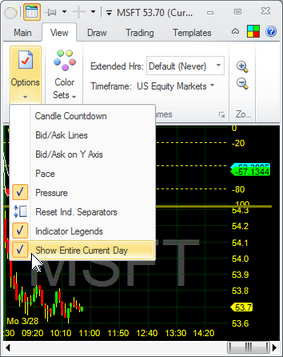
Show Entire Current Day Option |
|
If you set the Show Entire Current Day option in the View tab of the chart's ribbon menu, the rightmost side of the chart will always be at the end of current day, and there will be empty space between the current time and the right side of the chart. The price will keep filling in the chart left to right as the trading day continues.
|
|