Depth Chart Options/Navigation

Contents
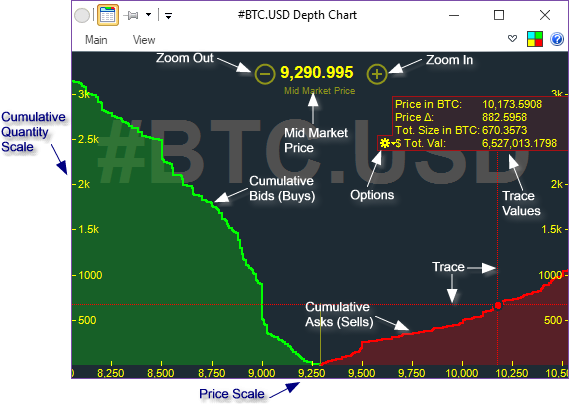
•Mid Market Price - this is the price that is half way between best bid and best ask. It is NOT the last trade price.
•Zoom In/Zoom Out - expands or contracts the Price Scale range to zoom in or out on the center of the book. You can also zoom in or out by using the mouse wheel while the mouse cursor is over the Depth Chart or by pressing the ![]() and
and ![]() keys.
keys.
•Cumulative Bids/Asks - the Y value of each point on the graph is the sum of all the quantities in the orders on the corresponding side of the book from the center to the point on the graph. What this represents is the snapshot of the current amount of the underlying coin (or $, if this is for a stock book) that it would take to buy/sell in order to drop or raise the price to the price on the X axis.
•Trace / Trace Values - as you move the mouse over the chart, the trace moves on the Price Scale with the cursor. The Trace Values corresponding to the current position of the trace are displayed.
▪Price - the current trace price on the X Scale
▪Price Δ - the price delta, the distance between Price and the Mid Market Price
▪Total Size - the Y Scale value, the cumulative quantity of all orders on the corresponding side of the book up to this point
▪Total Value - the total value of the cumulative orders up to this point
•Options - allows you to control which trace values are shown, and what kind of tracing is shown
▪Trace - the normal trace - shows values for the chart point over which the cursor hovers
▪Double Trace by Total Size - shows two points, one on each side of the chart, where the Total Size of one point matches the other
▪Double Trace by Price Delta - shows two points, one on each side of the chart, where the delta (the distance from midpoint) is the same