Greeks etc.
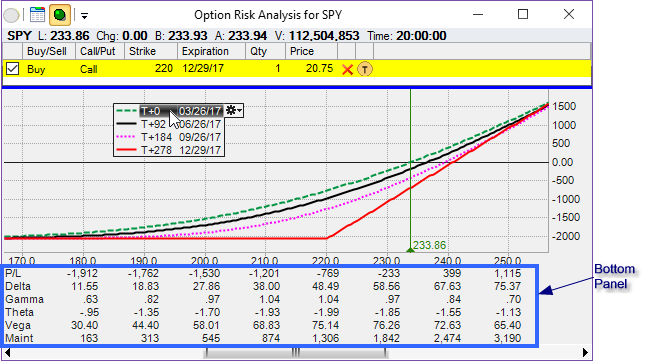
At the bottom of the graph the Option Risk Analysis window plots the various values corresponding to the X-axis price ticks shown.

Display of any or all values can be turned on or off in the ribbon menu's View tab in the Bottom Panel section. Note that the values are calculated only for the line that is selected in the Lines Legend box. To show the values for another line, select the other line by clicking on it in that box.

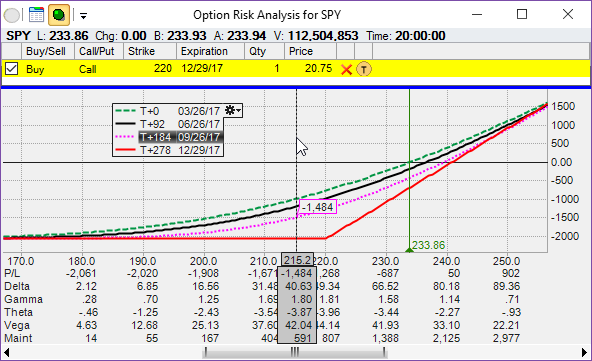
When you click/drag the cursor on the graph, you create a tracing line that will show the values of all the different greeks, P&L and Maintenance for the particular price of the stock (for the selected line. To remove the trace, click and drag off-window.
Note that the Maintenance value is currently calculated based on the TD Ameritrade published criteria. Different brokers use slightly different calculations.
