Historical Data

Contents
Overview |
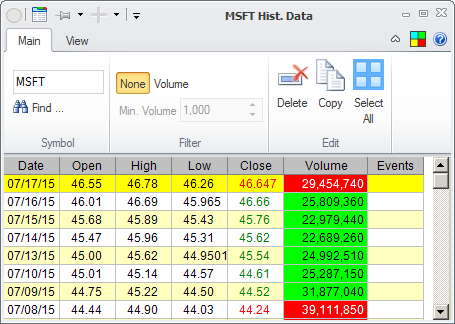
The Historical Data window will show you all the daily Open, High, Low, Close data that Medved Trader has recorded for the selected symbol. The most recent entry may be dynamically updated as the new real-time quotes come in for the symbol if the appropriate option is selected in Charts General Settings.
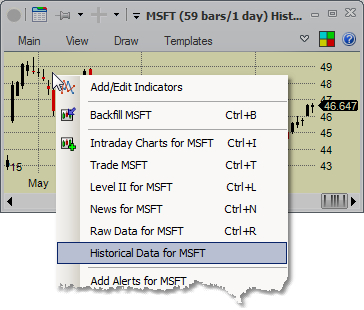
You access the Historical Data window for the stock by right-clicking on the security's historical chart, and picking the Historical Data for ... option from the menu that pops up.
Filtering |
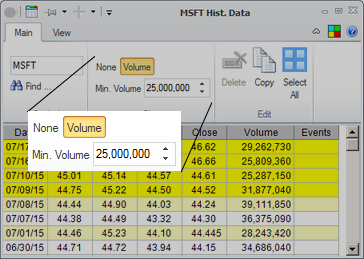
You can filter which data is shown in the Level II window. The Filter section on the Main tab of the ribbon menu gives you two options:
•None |
No filtering is applied. Every day that is recorded is shown in the table. |
•Volume |
Only the days where the volume exceeded a certain value are shown. You can set that value in the field below. |
Editing the Data |
You can highlight one or more consecutive rows in the data table by clicking (and, for multiple row selection, clicking while holding the ![]() key at the end of the desired selection) or by clicking on the start row of the selection and then using the
key at the end of the desired selection) or by clicking on the start row of the selection and then using the ![]() or
or ![]() keys while holding the
keys while holding the ![]() key. You can also select all data rows by either pressing
key. You can also select all data rows by either pressing ![]()
![]() or clicking on the Select All in the Edit section of the Main tab of the ribbon menu.
or clicking on the Select All in the Edit section of the Main tab of the ribbon menu.
Once you select one or more rows you can:
•Delete them - press |
Note that the next time you do historical backfill those quotes you deleted will be restored. Deleting is available to delete bad quotes that may have been filled in by some source. |
•Copy them - press |
The selected quotes will be put in your copy buffer so you can paste them in any document or spread sheet. |
Columns |
You can change the columns that show on the the Raw Data screen. The View tab of the ribbon menu allows you to turn on or off any of the following columns:
•Date |
The date of the trading session |
•Open, High, Low, Close |
The prices for that session |
•Volume |
The session's volume |
•Events |
Corporate Events - would be D for dividend ex-date, E for earnings release or S for split |
Highlighting |
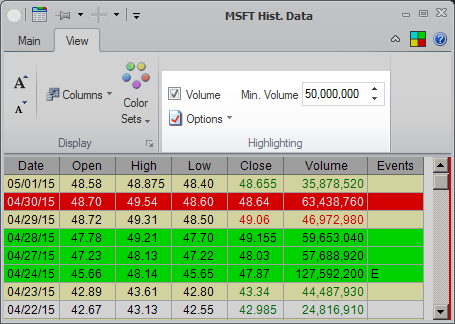
The Highlighting section of the View tab on the ribbon menu allows you to specify whether and how to highlight the rows. If you check the Volume box, then any rows that have volume greater than specified will be highlighted - with the color showing whether the day was positive (Open < Close) or negative (Open>Close).
Fonts and Colors |
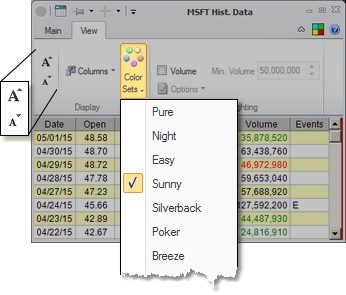
The display's font size and color palette can be changed on the View tab of the ribbon menu. The Color Sets are the same as on the portfolios.