Miscellaneous Other Features

Contents
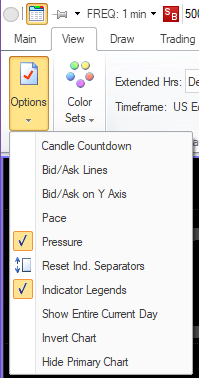
Here are some other chart features that exist in Medved Trader. They can be turned on/off on the chart in the ribbon menu's View tab's Options menu.
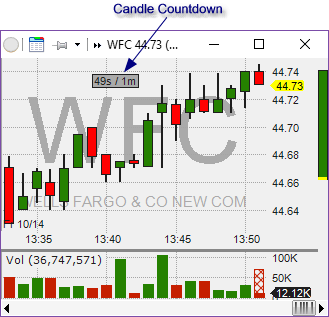
•Candle Countdown - shows you how far along the current candle is and how long it is until the next candle is started on the chart. It's obviously different for time-based charts vs. non-time-based (such as range- or volume- charts). |
|
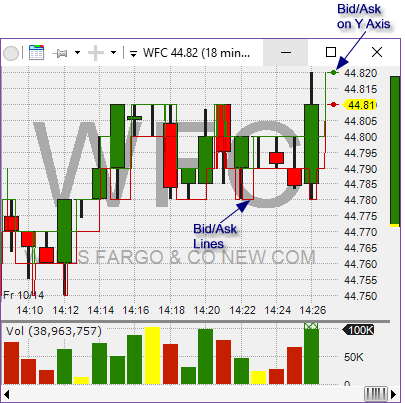
•Bid/Ask Lines and Bid/Ask on Y Axis - the Lines trace the bid/ask levels as the chart is built while the Bid/Ask on Y Axis shows the current bid and ask points on the very right of the chart. |
|
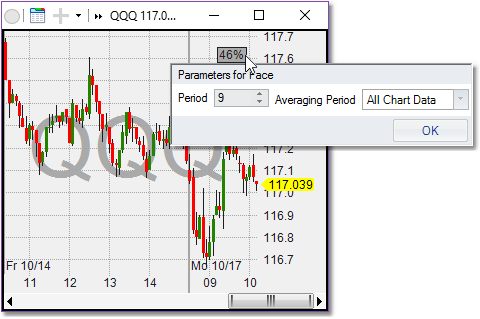
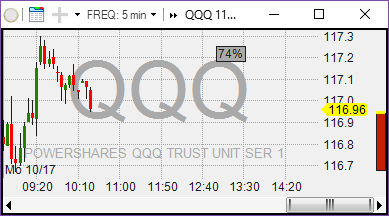
•Pace - like Candle Countdown, it shows up as a small box on the chart that can be moved/dragged anywhere on the chart. What it shows is the "pace" of trading.
You can set pace parameters by right-clicking on the box. The value of pace shown is the total trading volume for the last Period compared to an average volume for such a Period in the last Averaging Period. Values over 100% mean greater than average trading pace. |
|
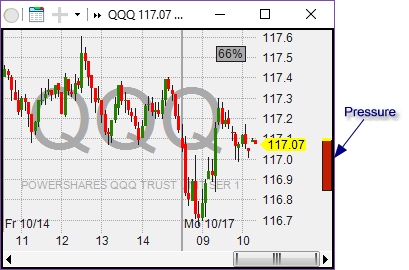
•Pressure - this is shown on the right of the chart as a vertical bar. It shows how many of the last 30 trades went off at bid vs ask. If more went off at bid, that shows selling pressure and the bar would be red, if more at ask it would be green. The size of the bar depends on the relative difference between buying and selling trades. |
|
•Reset Indicator Separators - this option will resize all non-main-chart indicators to be the same size. |
|
•Indicator Legends - turns on/off showing Indicator Legends at top left of each chart. |
|
•Show Entire Current Day - usually, Medved Trader will show only the portion of the day up to current time on the chart. If you want to show the whole day's span on the chart, select this option and the rest of the day will show up as empty space on the chart. |
|
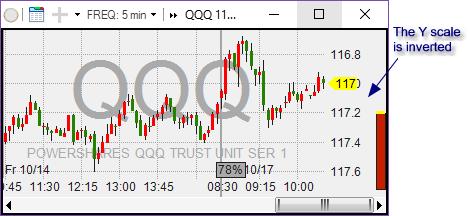
•Invert Chart - the usual Y-scale of the chart increases upwards. Sometimes people want to see that reversed. This option will invert the Y scale. |
|
•Hide Primary Chart - hides the candles on the chart, leaving only indicators showing. |