Special Columns

Contents
Most columns in Portfolios are self-explanatory, but a few need special explanation.
Pressure |
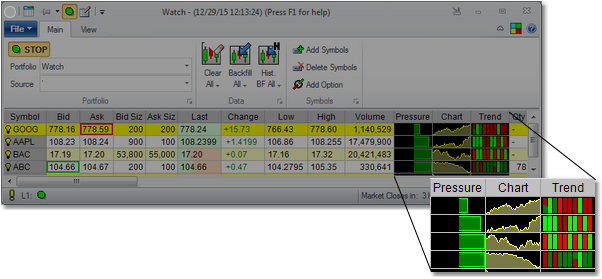
The Pressure column in the portfolio, for each symbol, shows, visually, the rough direction of the last 30 trades. The green (or red, in the other direction) indicator shows the percentage of the volume of trades in the last 30 trades that went off at or below the bid (red) vs. at or above the ask (green).
Chart |
The Chart column shows you a small chart for the symbol. Obviously not much detail is there, but the rough idea of the action can be gleaned from it. The period of the chart (last 10 minutes, last 1 hour, current day, etc) can be changed from the right click on the column. You may also switch it to a Historical chart (let's say one year chart).
Quote Trend |
Ten color coded bars that describe the bid/ask change direction of the latest quotes. Each bar signifies a change in bid, ask or both. The latest bar is added to the right as the trend scrolls to the left.
Each time a new tick comes in with either a bid or ask change, a new bar is added:
•bid or ask price increases - a GREEN bar is added.
•bid or ask price decreases - a RED bar is added.
•bid increases and ask decreases - the top half of the bar is RED and the bottom half is GREEN.
•bid decreases and ask increases - the top half of the bar is GREEN, and the bottom half is RED.
•both bid and ask increase - a bright GREEN bar is added.
•both bid and ask decrease - a bright RED bar is added.