The Dashboard

Contents
Accessing the Dashboard |
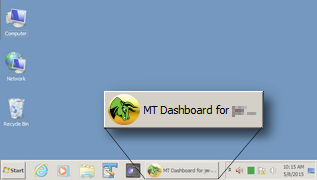
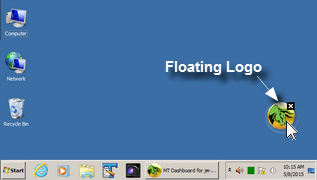
The Dashboard is the main window of Medved Trader. From it, you can access every feature available. There are several ways to open the dashboard, depending on how you have your preferences set.
Quick Access Menu Dashboard |
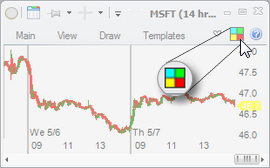
In addition to the separate-window-dashboard, there is also the Quick-Access Menu Dashboard that can be accessed in two ways:
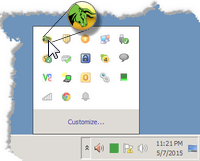
•In any MT window, click on the Dashboard icon in the top right corner of the ribbon menu or press |
|
Using the Dashboard |
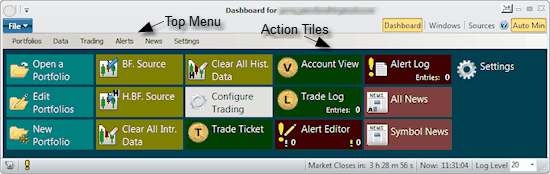
There are two ways to access various MT features from the dashboard. One is to use the menu at the top of the Dashboard window. The other is to use the Action Tiles in the dashboard.
Customizing the Dashboard |
To customize the dashboard, you can remove any tile from the dashboard by right-clicking on it and using the Hide Tile option. To put the tile back on the dashboard, open the top menu and drag the appropriate menu item to the dashboard area. You can also rearrange the tiles by dragging them around the dashboard and dropping them where you want them.
Other Dashboard Window's Features |
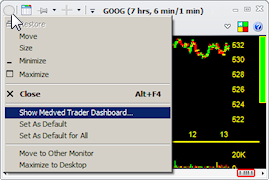
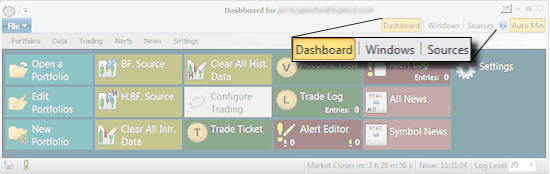
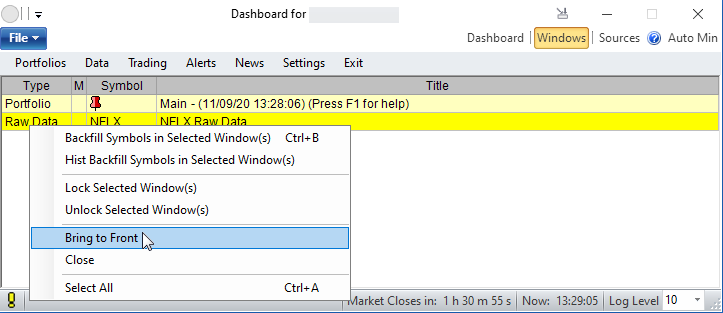
The dashboard can also show you currently open MT windows and allow you to close them or bring them to front...
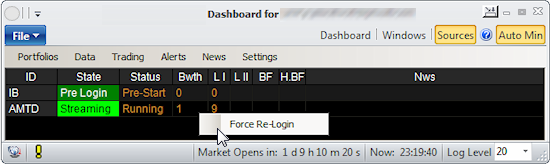
and it can show you all currently running data sources, how many subscriptions they have and their current running bandwidth, and allow you to force re-login on any of them:
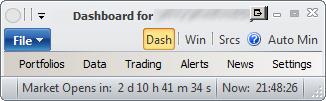
The bottom status bar on the dashboard also shows:
•the current Log Level (for debugging purposes. Should be set to 10 so that if there are any problems/bugs/errors they would show up in the log and you'd be able to send it to us).
•current time
•when market closes or opens based on default timeframe as set in Settings - Charts - Timeframes
•alert indicator (click on it to get the alert menu)
•new MT update available indicator
For minimalists, you can remove all tiles from the dashboard and resize it so that only the top menu is visible. That way it would take up the least space on your screen: