Charts - Navigation and zooming

Contents
Using the mouse |
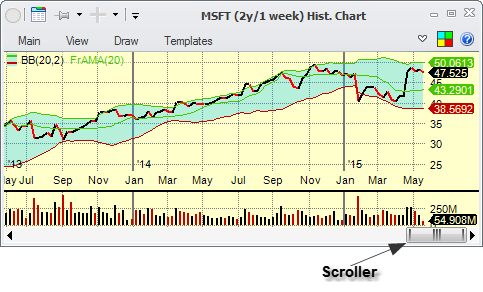
There is a scroller at the bottom of each chart that shows you which part of all data is being shown on the chart and allows you to move back and forth in the chart, as well as zoom in and out. Grab the scroller and move it in order to scroll the data in the chart forward and backward in time. Grab one of the sides of the scroller and drag it in order to change the amount of data shown.
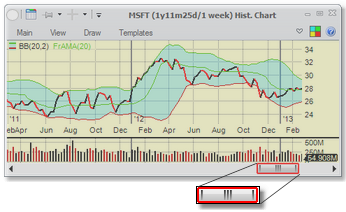
If the scroller is not flush right on the chart (that is, if there is data that is not shown to the right of the visible data), it will have a red border around it: |
|
You can also move the scroller back and forth by using the scroll wheel on the mouse while the chart window is active. Pressing the ![]() key while using the scroll wheel on your mouse will zoom in or out on the chart.
key while using the scroll wheel on your mouse will zoom in or out on the chart.
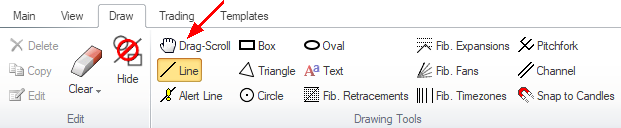
Another way to scroll the chart is to change to Drag-Scroll in annotations, then just click and drag on the chart itself. Note that if you do that, you have to switch back to one of the annotations in order to be able to draw them on the chart.
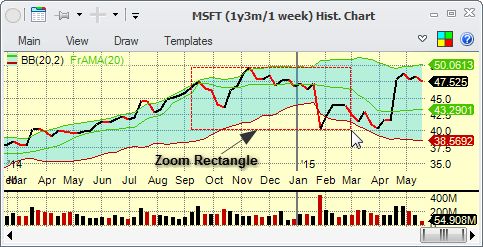
Another way to zoom in is to press the ![]() key and draw on the chart with the mouse. That will show the region to zoom into with a red outline. When you release the mouse button, the chart will zoom in.
key and draw on the chart with the mouse. That will show the region to zoom into with a red outline. When you release the mouse button, the chart will zoom in.
Using the keyboard |
•Pressing the ![]() and
and ![]() keys on the keyboard will move the scroller right and left.
keys on the keyboard will move the scroller right and left.
•![]() and
and ![]() keys will move the scroller faster.
keys will move the scroller faster.
•![]() will go to the very beginning of the chart, putting the scroller in the leftmost position.
will go to the very beginning of the chart, putting the scroller in the leftmost position.
•![]() will go to the very end of the chart with scroller in its rightmost position.
will go to the very end of the chart with scroller in its rightmost position.
•![]() and
and ![]() keys will zoom the chart in and out.
keys will zoom the chart in and out.
Using the ribbon menu |
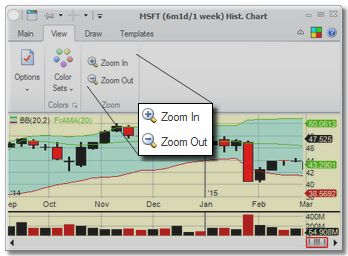
One more way to zoom in and out is to use the zoom options on the ribbon menu.