Charts - Indicators

Contents
Adding indicators |
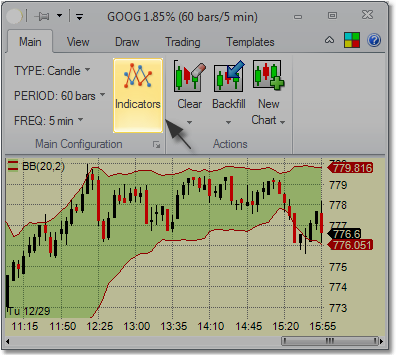
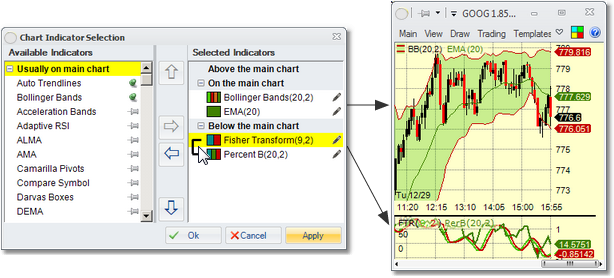
Indicators can be added to charts by clicking on the Indicators button in the Main ribbon menu tab. Doing that opens the Chart Indicator Selection window.
Here you can add any of the available indicators to the chart by ether•double-clicking on the indicator in the Available Indicators list •dragging the indicator from the Available Indicators list to the Selected Indicators list, or •highlighting the indicator in the Available Indicators list and clicking the Note that the indicators can be shown on the main chart (also called the price chart) or on chart panels above or below it. Some indicators (in the list under the Usually on main chart heading) are traditionally shown on the price chart, others usually go on separate panels.Click the Ok button to add the indicators on the chart and close the selection window. The Apply button would add the indicators without closing the selection window. |
|
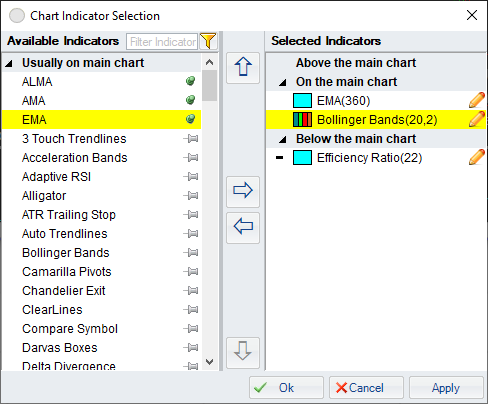
You can also drag/drop indicators in the Selected Indicators list in order to re-arrange their order or to move them from one section to another one.
Searching Indicators |
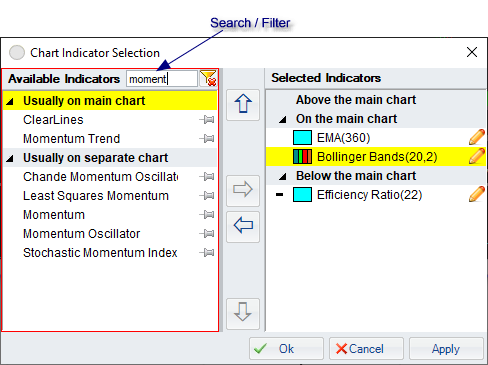
There are a lot of indicators and the one you want may be hard to find in the list. Just start typing - the focus will switch to the search field and the indicators will be filtered according to the search text you input.
Finding information on indicators |
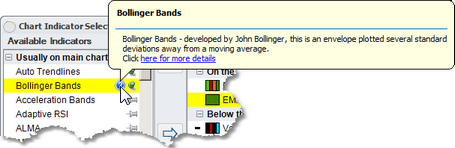
When you put your mouse over any indicator in either of the lists, an info icon (![]() ) will appear next to it. Click on it to see some information on the indicator and usually a link to explain the indicator in more detail).
) will appear next to it. Click on it to see some information on the indicator and usually a link to explain the indicator in more detail).
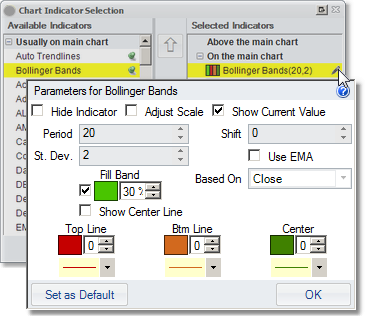
Editing the indicators' parameters |
Clicking on the edit icon (
•Hide Indicator - will not show the indicator on the chart, but will leave it in the Selected Indicators list.
•Adjust Scale - when Y axis is dynamically sized, it usually takes into account only the price data. When this option is chosen, the Y axis is adjusted so that the whole range of the indicator is visible. •Show Current Value - will show the current value of the indicator (or several values, depending on the indicator), on the Y axis.
|
|
|
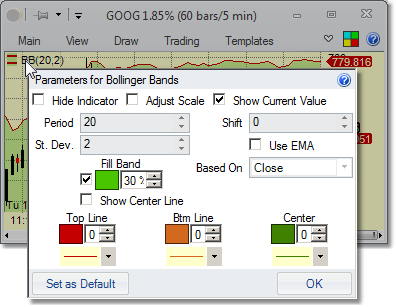
As you hover the mouse over the indicator or its legend on the chart, it will change colors or thickness or give you another indication (depending on the Highlight indicator when mouse hovers: parameter in the Settings - Charts - General),
You can edit indicator parameters by clicking (or double-clicking, depending on the Indicator Edit Action setting in the Settings - Charts - General), on the indicator's legend or on the indicator itself on the chart. |
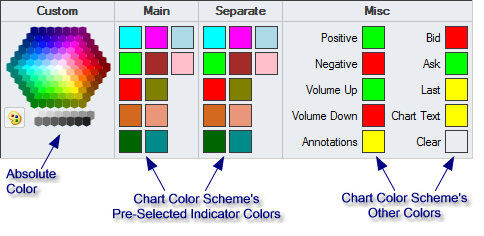
Selecting colors for indicators: you can
•pick one of the colors in the color hexagon. •click on the palette below the hexagon to mix your own color •pick one of the pre-set colors for the color scheme of the chart on which the indicator resides. Those include pre-selected indicator colors as well as other color scheme colors (such as Positive, Negative, Bid, Ask). The advantage of picking the color scheme colors is that if you change the chart's color scheme, the colors will change with it, staying distinctive and visible on the chart. |
|
Removing indicators from charts |
Indicators can be removed from the chart by deleting them in the Chart Indicator Selection window. You can also remove them by right-clicking on the indicator or its legend and selecting the Delete options.
Removing indicator legends from charts |
Sometimes, especially when chart windows are small, indicator legends get in the way. They can be removed from the chart by un-selecting the Indicator Legends option in the Options on the View tab of the chart's ribbon menu.
Linking indicators together |
All the Usually on the main chart type indicators that are placed on the main chart show up together and share the main chart's scale. Other indicators that are placed on the main chart are also shown there, but on the lower third part of the chart.
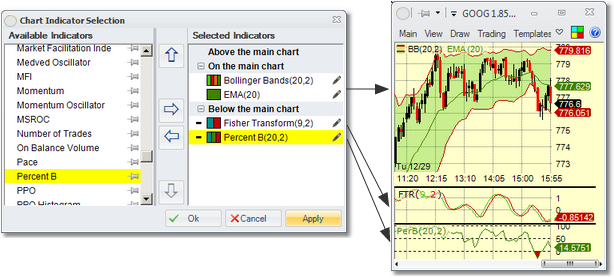
In contrast, the indicators that are placed in the Above the main chart and the Below the main chart sections show up on separate panels, one per indicator.
In order to have such indicators show on the same panel, you can link them by clicking in-between the pips of the indicators on the Selected Indicator list. The two (or more) indicators linked in this way will show up together and MT will attempt to have them share the same Y axis unless they have very different scales. In that case, the second scale will go on the other side of the chart.
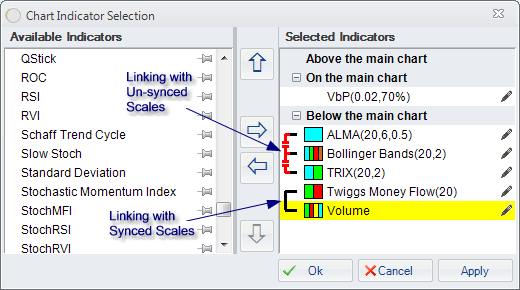
If you prefer to force it so that each linked indicator has its own scale, click on the link again. It will change to a red broken link, which means that MT will not attempt to use the same scale for the linked indicators. Click again to un-link.