Advanced Editor

Contents
To start the Advanced Paintbar Editor is to start with the Simple Paintbar Editor, enter a basic rule or two, then switch to the Advanced editor by clicking on the Switch to Advanced button.
Note: once the paintbar is saved in the Advanced state, you can't go back to the Simple mode.
Simple to Advanced |
Here is an example of a simple paintbar from the previous Simple Editor section - all it does is checks if the Close of a candle is above all of the three EMAs (with periods of 7, 21 and 40) and if it is, sets the paintbar color. Let's convert it to an Advanced paintbar.
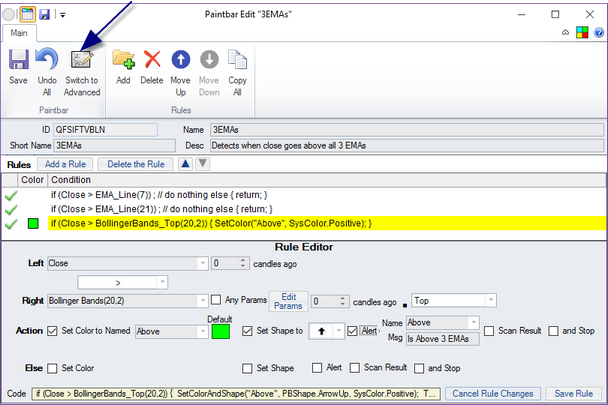
To do that, click on the Switch to Advanced button in ribbon menu. After clicking through the warning dialog that pops up, the paintbar will be converted to this:
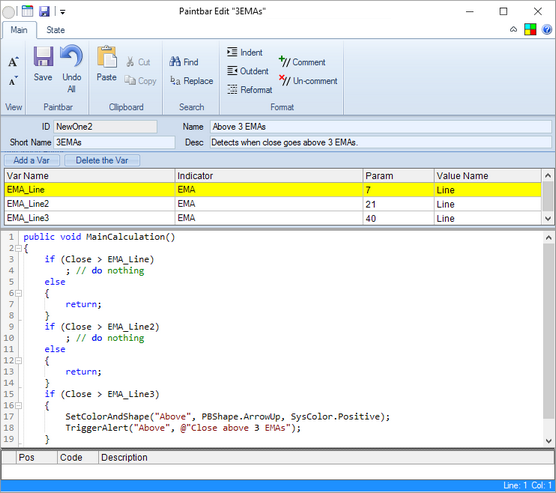
The two paintbars are exactly equivalent to each other. Let's take a look at the Advanced Paintbar Editor.
Sections of Advanced Paintbar Editor |
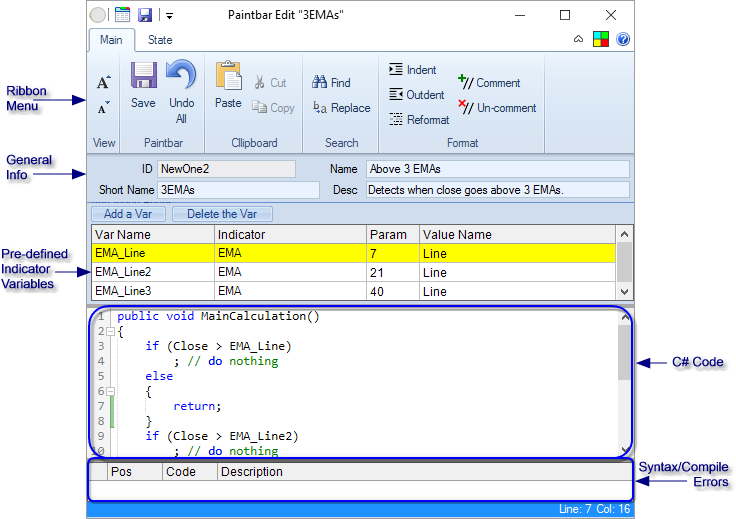
General Info |
In this section you enter the paintbar's ID, its name and short name (the short name shows up in legends on charts) and the description of the paintbar.
If your paintbar uses any indicators, in this section you define the variables you use to refer to the indicator in your C# code. For each indicator variable, you give it a unique name, which indicator it refers to, the indicator's parameters and which one of the indicator's sub-values the variable will represent.
Just like with a Simple paintbar, you may choose not to select the parameters for the indicator. In that case the paintbar, for that indicator, will take the first existing indicator of that type in the chart on which it is placed. This allows the user of the paintbar to manipulate the values of the indicator's parameters and gives more flexibility to the paintbar. If the paintbar is placed on a chart that has no such indicator, the default values for the indicator will be used.
C# Code |
This is where you enter and modify the C# code that is the body of the paintbar. You must have a function that is defined as public void MainCalculation() in your code. That is the function that is called for every paintbar bar to calculate its parameters.
Other than that function, you can define other variables and functions to help you with calculating the paintbar.
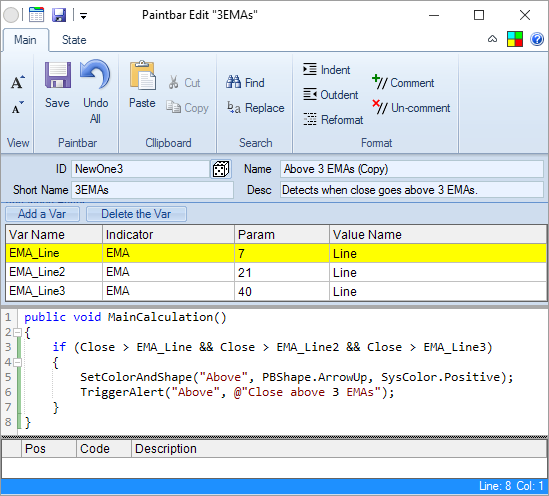
As an example, the code that was converted from the simple paintbar in the example above can be simplified in C# to:
The syntax errors for the code are shown in the table below the code editor. Double-click on the error to move the editor cursor to where the error was detected. Right-click on the error to copy its text.
Some Essential Hints for your C# Code |
•The Auto-complete and Intellisense-like features in the C# paintbar editor are your friend.
•There are pre-defined variables Open, High, Low, Close and BarVolume that describe the current candle's values. They have functions (like .Crosses) to make it easier to compare them to other values.
•Another pre-defined variable Timestamp is the DateTime type variable that is current candle's timestamp. You can also use it to find the current trading session's parameters and find where you are in the trading session.
•There are also pre-defined indexed variables PBarColor and PBarShape, that can reference previous bars' paintbar color and shape, if set by the paintbar calculation.
•For any of the pre-defined variables, including the Indicator Variables, you can index them by appending the [n] to them. Thus, Open[2] would mean the Open value of a candle 2 bars ago and PBarColor[1] would mean the color of the paintbar one candle ago. You don't have to specify the [0] index, that is implicit.
•The indexing described above works differently for Horizontal Line and Pivot indicators. For those, the [n] means n days ago (or n periods ago if the period for the indicator is not one day).
•SetColor, SetShape and SetColorAndShape are the "action" functions that set the colors and shapes of the paintbars.
•SetYValue function allows you to actually define where the paintbar's shape will appear on the chart, with no regard to the user's setting. That allows you to make the paintbar into a kind of an indicator. NOTE: this function REQUIRES that a SetColor is called before it to give the line that is formed from these dots a color.
•SetYValue function can create a "cloud" paintbar or show bars instead of lines. See the SetYValue definition.
•TriggerAlert function is used to trigger an alert.
•SetScanResult function is used to set a scan result or results (so that the code can be used in a scan).
•SetScanResultColumnName function is used to set the scan result column's caption
Paintbar as a State Machine |
The paintbars (and indicators in general) are, internally, state machines. What that means in abstract is that there is a saved "state", the paintbar or indicator calculation is performed based on that state and the candle that is passed to the calculation, then a new state is generated (that includes the output of the paintbar or indicator).
For simple paintbars, that state machinery is hidden, because it is implicit. The SetColor etc. functions set the current state, and the Open, Close, etc. indexed variables as well as Indicator Variables are passed in as part of the current state.
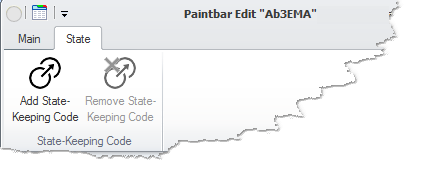
If you want to do something more complex, the state machinery needs to be explicit. The Advanced Paintbar Editor will add the state-keeping functions in for you - that functionality is in the ribbon menu's State tab.