More Than One Symbol on a Chart

Contents
More than one symbol on a chart |
You can plot more than one symbol on a chart. There is always one main symbol but there may be one ore more Compare symbols. This is done by adding a special Compare Symbol indicator on the chart. This can be done by just placing that indicator on the chart or, more conveniently, by just typing the symbol and clicking the Compare Symbol button in the dialog that pops up (see here for a more thorough explanation).
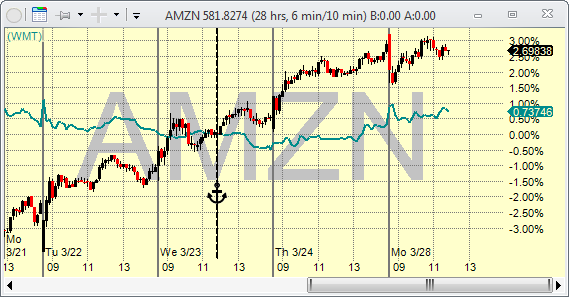
Above, you can see an AMZN intraday chart with a Compare Symbol indicator for WMT placed on it. When the Compare Symbol indicator is placed on the main chart, the vertical scale can show the stock's price, as usual, or it can show the % difference between the main price chart and the compared symbol. To change the axis scale, right-click on it.
Note also the anchor line on the chart. The line shows at what point the prices are matched for the purpose of comparing them. Move the anchor line to change that point.